Kilo Code Deep Dive: Where Agentic IDE Tooling Shines and Where It Still Stumbles
I've spent enough hours wrestling with AI coding assistants to know that most of them either give you too much freedom with no guardrails or lock you into rigid workflows that break the moment your task gets interesting. When I first looked at Kilo Code, I expected another me-too VS Code extension with a chat panel bolted on—but what I found was a surprisingly opinionated system built around specialized agents, granular permissions, and an observability stack that treats agentic reliability as a first-class concern. That said, the deeper I dug, the more I noticed real architectural trade-offs: sequential MCP execution, deprecated modes still floating in the UI, and context-visibility features that are half-shipped. Let me walk you through what genuinely impressed me and where I think Kilo Code still has meaningful work to do.
Specialized Agent Modes: The Core Value Proposition
When I examine Kilo Code's agent architecture, what immediately stands out is the deliberate separation of concerns across five distinct behavioral profiles. Rather than exposing a single monolithic assistant with blanket permissions, the platform gates every mode behind a specific tool-access matrix. This design tells me the developers prioritized both safety and contextual precision—two things that usually get sacrificed in general-purpose coding agents.
How Permission Boundaries Define Each Mode
Kilo Code gates each profile behind a precise tool-access matrix. I see this as a safety-first alternative to the monolithic assistants that default to full write access:
Code (Default): Full tool access with zero restrictions. The agent can invoke
read,edit,glob,grep,bash,task,webfetch, and any MCP server tools. I treat this as the workhorse profile because it is the only mode that can modify files, execute arbitrary shell commands, and pull external documentation in a single pass. The unrestrictedbashaccess combined witheditrights means the agent can refactor code, install dependencies, and run tests without asking for elevation.Ask: Strictly read-only. The agent retains
read,glob,grep, andlist, plus a carefully whitelisted subset of bash commands:cat,grep,git log,git diff, andjq. Every MCP tool call requires explicit user approval on a per-call basis, and all write operations are blocked at the policy level. I find this particularly useful when I want to interrogate a codebase's history or structure without risking accidental modifications. Thejqinclusion is a nice touch—it means JSON log analysis and API response inspection happen natively without leaving the read-only sandbox.Plan: Read-only tools plus a narrow write exception: file edits are restricted to the
.kilo/plans/directory. This creates a dedicated space for system design and architecture discussions where the agent can draft technical specs, sequence diagrams, or implementation roadmaps without touching source files. The directory scoping is hard-coded, so even if the agent hallucinates a file path, it cannot break out of that boundary.Debug: Identical permissions to Code, but behaviorally optimized for methodical troubleshooting. The agent prioritizes step-by-step root cause analysis over feature implementation. Having full
editandbashaccess here makes sense because debugging often requires the same destructive capabilities: editing configs, inserting log statements, and running diagnostic scripts.Orchestrator: Deprecated and scheduled for removal. The subagent coordination it once handled is now native to the
tasktool, which agents in full-access modes can invoke directly. I view this as healthy architectural consolidation; folding delegation into the tool layer removes a redundant wrapper and simplifies the UI surface without losing capability.
Switching Modes Without Breaking Flow
The transitions are built for keyboard-driven workflows:
- Sidebar dropdown: Click to select the target mode visually.
- Slash command: Type
/agentsin the command palette. - Keyboard shortcut: Press Cmd+. on macOS or Ctrl+. on Windows and Linux; hold Shift to reverse the cycle.
These overlapping input methods mean I rarely have to break flow to reconfigure the agent's behavior. When I am deep in a debugging session and realize I need read-only reconnaissance first, the Ctrl+. shortcut gets me into Ask mode in under a second. The /agents slash command is equally handy when I already have the command palette open and do not want to reach for the mouse.
This multi-layered control scheme reinforces a core principle I see throughout Kilo Code: the agent should adapt to the developer's context, not the other way around. By hardcoding permission boundaries at the mode level and making the transitions frictionless, the platform lets me match tool authority to intent before a single line of code gets touched.
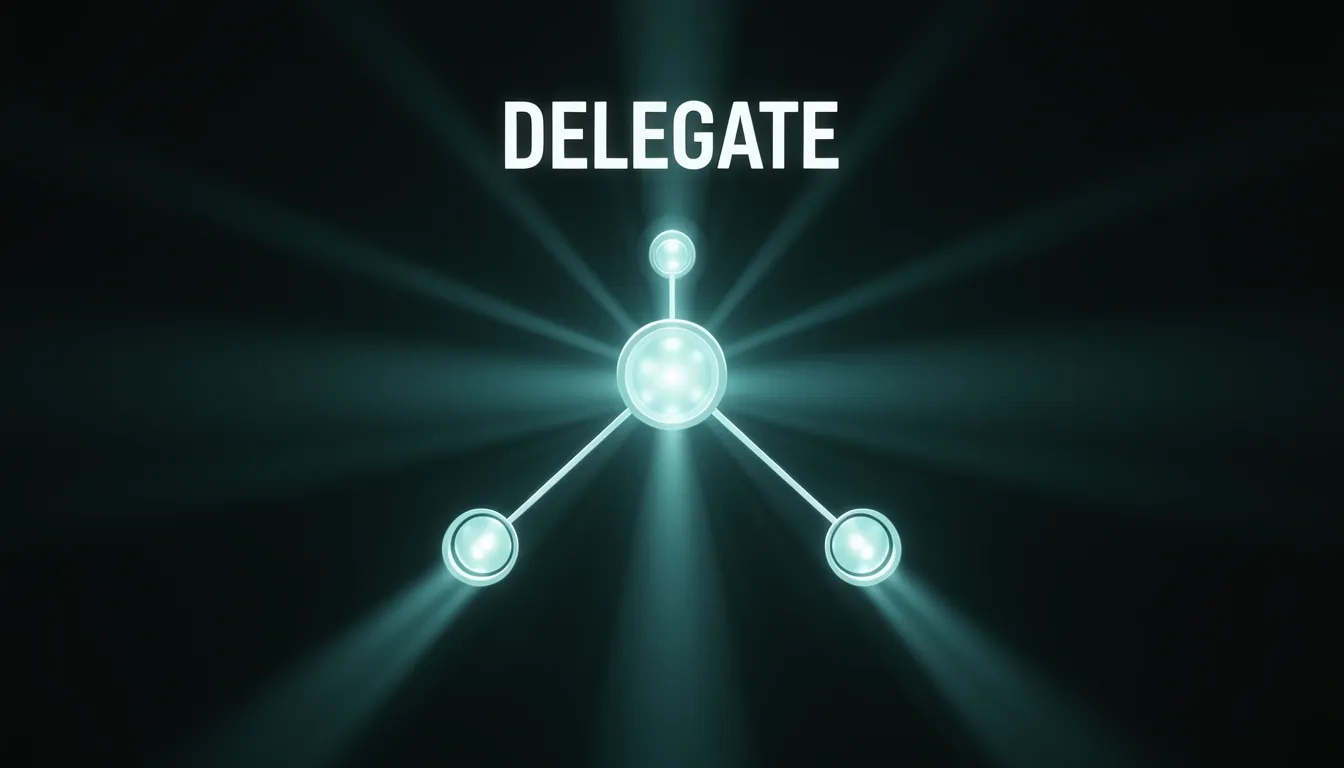
Native Subagent Delegation and the Task Tool
I noticed that deprecating Orchestrator mode streamlines the architecture in a meaningful way. Rather than forcing everything through a dedicated coordination layer, the Code, Plan, and Debug agents now handle subagent delegation natively via the task tool. When a parent agent hits a workstream that benefits from isolated execution, it spins up a fresh subagent session and specifies either general for autonomous work or explore for focused codebase research. The parent retains high-level oversight while the child handles the specifics.
How Isolation and Concurrency Actually Work
The isolation model here is strict by design. Each subagent runs inside its own sandboxed context with a completely separate conversation history and zero shared state with the parent. I find this approach particularly sound because it prevents context pollution—subagents cannot leak intermediate reasoning or partial failures back into the parent's thread unless explicitly summarized. The data flow is intentionally asymmetric: detailed instructions travel downward when the subtask is created, while only a concise summary bubbles back upward upon completion. This keeps the parent agent focused on coordination without drowning in low-level execution noise.
generalsubagents: Handle autonomous work without tight supervision from the parent.exploresubagents: Focus specifically on codebase research and navigation.- Parallel execution: Agents can fire up multiple subagent sessions concurrently, which means the parent can delegate independent workstreams in parallel rather than blocking sequentially.
- State boundaries: No shared memory between parent and child means cleaner failure domains—if a subagent goes off track, the damage stays contained.
Task Permissions and the @ Autocomplete Escape Hatch
Programmatic delegation is gated by the task permission system, which I see as a necessary guardrail. Administrators define what subagents can be invoked automatically using glob patterns, giving flexible matching without listing every single agent explicitly. If a rule resolves to deny, the subagent disappears entirely from the Task tool's description, so the parent agent does not even know it exists as a programmatic option. Rules evaluate in order, and the last matching rule wins, which creates a predictable override mechanism.
What stands out to me is the intentional separation between programmatic and user-driven delegation. Even if task permissions block an agent from being called automatically, users retain full access through the @ autocomplete menu. This means the permission layer only restricts autonomous agent-to-agent delegation; it never blocks the human in the loop from reaching for the right tool directly.
Custom Agent Support Since OpenCode v1.14.39
As of OpenCode v1.14.39 and later, the subagent_type parameter broke free from its built-in type constraints. It now accepts any configured agent name, not just the hardcoded general or explore categories. This change is more impactful than it looks at first glance because it lets primary agents delegate to custom subagents while preserving their full configuration—prompt templates, tool access, and behavior rules all travel with the call. I see this as the point where the architecture truly opened up: instead of forcing every workflow into a predefined shape, teams can now spin up specialized subagents for specific domains and trust the task tool to route work to them intact.
This architecture trades the rigid choreography of the old Orchestrator mode for a decentralized, permissioned delegation model. By keeping subagents isolated, summaries concise, and permissions explicit, the system gives developers parallel execution power without sacrificing control over what automated agents are allowed to do.
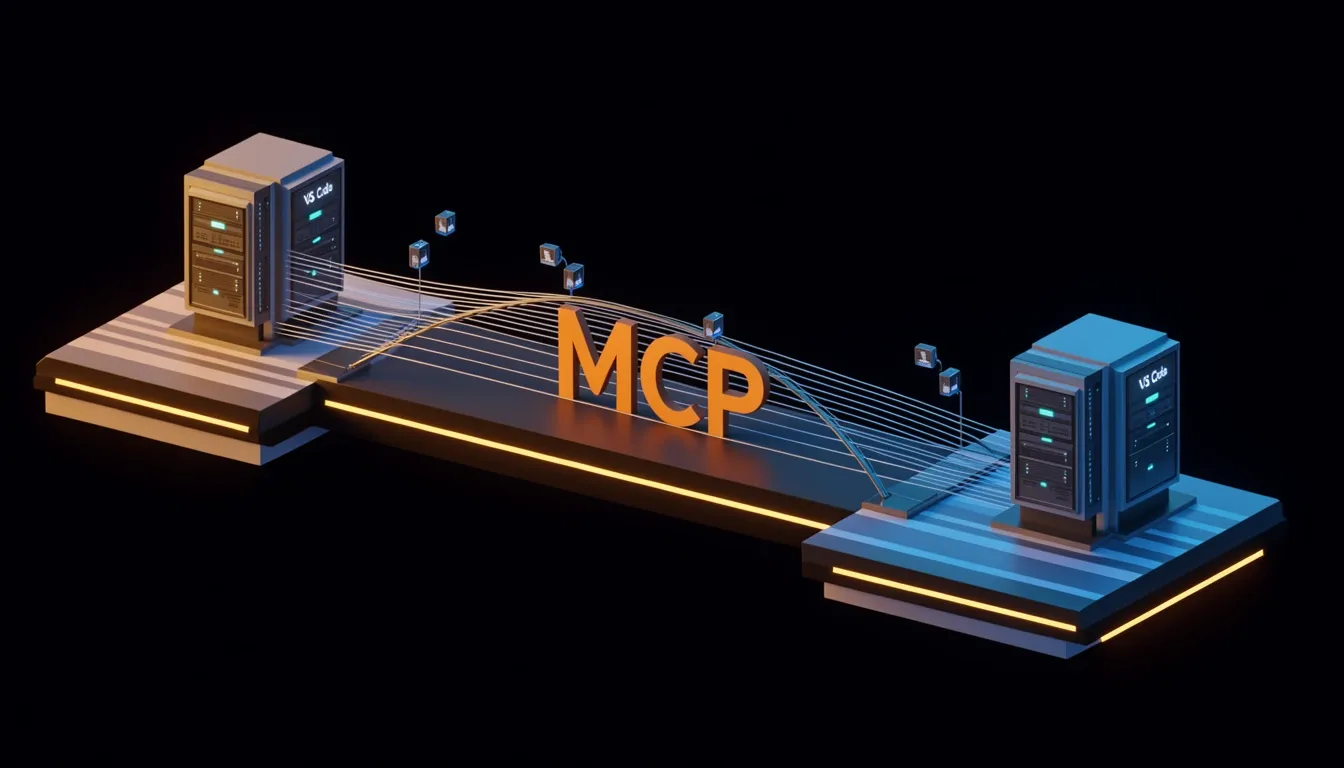
MCP Integration: Power with Constraints
When I look at how Kilo Code handles external tool integration, the use_mcp_tool mechanism stands out as a tightly controlled bridge to the broader MCP ecosystem. It requires three explicit parameters every time: server_name to identify which MCP server you're targeting, tool_name to specify the exact operation, and arguments as a JSON object that must conform to the tool's input schema. That last parameter can be an empty {} when no inputs are needed, but the structure itself is non-negotiable. Under the hood, Kilo Code leans on the @modelcontextprotocol/sdk library to enforce standardized protocol compliance, which means the integration isn't just ad-hoc scripting—it's built against a formal specification.
Transport Architecture and Validation
The transport layer offers two distinct paths depending on where the MCP server lives. For local processes, StdioClientTransport handles communication over stdin/stdout, which works well for CLI-based tools running on the same machine. If the server lives remotely or needs HTTP-based interaction, SSEClientTransport steps in using Server-Sent Events. I appreciate that this split isn't arbitrary—it reflects real deployment scenarios, from local development utilities to networked services. What really catches my attention, though, is the dual-layer Zod schema validation. Both the Kilo Code client and the server run validation checks, creating a defensive boundary against malformed requests and potentially malicious inputs. This isn't just client-side trust; it's a verification handshake that protects the agent from injecting bad data into external systems.
Configuration Scope and Team Consistency
Setting up MCP servers in Kilo Code follows a hierarchy that mirrors how development teams actually organize their tooling. You can define servers globally through VS Code extension settings, which applies across all your workspaces. Alternatively, project-level configuration lives in .kilocode/mcp.json at the project root. Here's where the precedence rules matter: if a project-level server shares the same name as a global one, the project-level definition wins. In my view, this is exactly the right call—it lets teams override personal defaults without forcing developers to purge their global configs. Better yet, that .kilocode/mcp.json file can be committed directly to version control, so the entire team inherits the same MCP tooling expectations without manual setup drift.
Execution Constraints and Real-World Friction
Where the integration starts to show friction is in execution semantics. use_mcp_tool calls are processed sequentially, with no parallel execution path. When I'm thinking about agentic workflows that might need to hit multiple tools concurrently—say, querying a database schema while simultaneously fetching documentation—the lack of parallelism becomes a real throughput bottleneck. The approval model adds another layer of friction. Every invocation requires explicit user approval unless the tool has been pre-approved in the always allow list. While this is clearly a security-minded design, it breaks the illusion of full automation. If you're trying to build a hands-off pipeline where the agent iterates rapidly, stopping to click "approve" on every tool call turns the workflow into a supervised session rather than an autonomous one.
Then there's the hard dependency on external infrastructure. If an MCP server goes offline or becomes unreachable, the invocation fails outright—there's no graceful degradation or fallback mechanism baked in. I also notice that tool capabilities vary wildly between servers, which forces the agent to adapt to server-specific interfaces rather than working against a uniform abstraction. Perhaps the most architecturally significant constraint is that MCP tools run entirely outside VS Code and have zero access to VS Code extension APIs. This means your MCP tools can't interact with the editor's internals, decorations, or language services directly. Finally, distribution remains a manual burden: deploying these capabilities requires users to set up the MCP server themselves, which complicates onboarding and makes "it works on my machine" a genuine risk when .kilocode/mcp.json references servers that half the team hasn't installed yet.
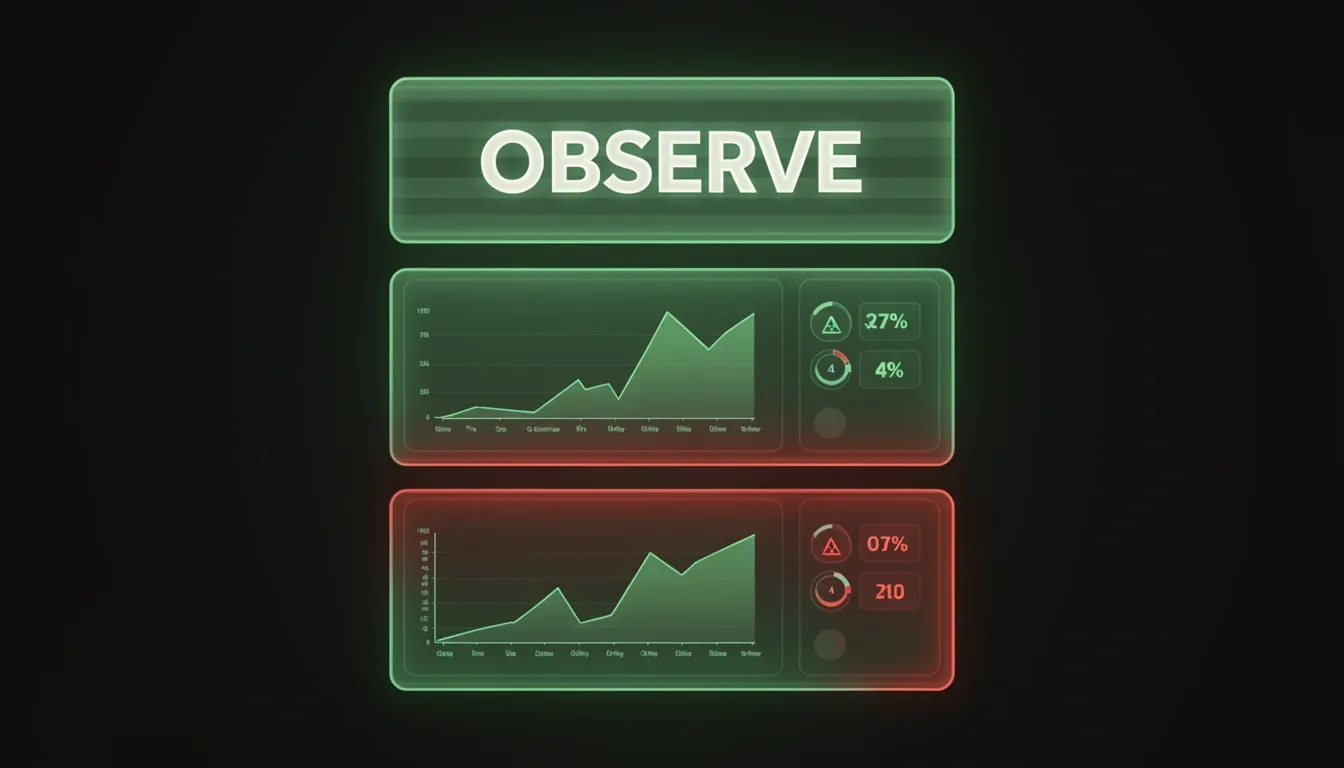
Observability: Three-Phase Monitoring Stack
When I look at how Kilo Code handles observability, I see a system built specifically for the chaos of autonomous agent execution. Unlike traditional application monitoring that treats an API call as an isolated event, this stack traces the entire lifecycle from individual LLM requests through to final session outcomes. The architecture splits into three distinct phases, and I think that separation is what makes it genuinely useful for debugging agentic behavior.
LLM Observability and Multi-Burn-Rate Alerting
Phase 1a drills into every single API call with granular metadata: Provider, Model, Tool, Latency, Success/Failure status, Error type and message, Token counts (both input and output), and the Source (whether the request came from CLI, JetBrains, or VSCode). Dashboards let operators filter by provider, model, and tool to inspect Error rate, Latency percentiles (p50, p90), and Token usage.
What stands out to me is the alerting strategy. Instead of simple threshold alerts, Kilo Code implements multi-window, multi-burn-rate alerting against error budgets. A 5-minute window at 14.4x burn rate triggers a Page for a Major Outage. A 30-minute window at 6x triggers a Page for an Incident. A 6-hour window at 1x creates a Ticket flagging a Change in behavior. I notice that paging only fires for Recommended Models routed through the Kilo Gateway; alerts for other models generate tickets that teams can configure to ignore. The initial conditions cover LLM API error rate exceeding SLO, Tool error rate exceeding SLO, and p50/p90 latency exceeding SLO—all scoped per tool, model, and provider. This granularity prevents a noisy provider from drowning out signal on a critical model.
Session Metrics and Stuck-Agent Detection
Phase 1b shifts focus from individual calls to session health, aggregating data at session close or timeout. It tracks Total errors by error type, but more importantly, it catches Agent stuck errors—those frustrating scenarios involving repetitive tool calls and infinite loops. It also surfaces Tool call errors like execution failures and timeouts. I find this layer essential because an agent can technically return 200 OK on every API call while still failing completely by looping endlessly.
Behavioral Pattern Recognition in Tool Usage
Phase 2 moves beyond raw errors into behavioral analysis. The system detects Termination reason (user closed, timeout, explicit completion, or error), counts identical tool calls within a session (same tool plus same arguments), and counts identical failing tool calls (same tool, same arguments, same error). It also spots oscillation patterns where the agent alternates between two states without making progress.
For progress tracking, Kilo Code monitors:
- Unique files touched per session
- Unique tools used per session
- The ratio of repeated to unique operations
These metrics give concrete visibility into whether the agent is actually advancing toward a goal or just spinning its wheels. When I see a high ratio of repeated operations paired with oscillation flags, I know the agent is stuck in a decision loop rather than executing meaningfully.
Session Outcome Classification
Phase 3 closes the loop by classifying what actually happened. It collects explicit signals like thumbs up/down rates, sentiment, and user abandonment patterns. Then it adds implicit signals by running LLM analysis of session transcripts to classify termination as completed, abandoned, errored, or timed out.
To me, this is where the stack gets clever. Relying solely on explicit user feedback creates a massive blind spot—users often just close the tab. By having an LLM analyze the transcript to determine if the session actually completed its task, Kilo Code fills that gap without requiring additional user friction. The combination of explicit and implicit signals gives a much more honest picture of agent success rates than traditional uptime metrics ever could.
Context Visibility: The Half-Shipped v7 Improvements
Looking at Kilo Code's v7 tracking issue #8415, I see a focused attempt to reduce cognitive overhead in agentic workflows. The 2026-04-30 update—currently sitting at just 9 reactions—groups four context-visibility improvements together, yet only one has actually shipped. That 25% completion rate tells me the team recognizes the problem but hasn't fully cleared the UX debt yet.
The One Feature That Made It
Issue #8210 (completed) delivers a turn-by-turn token and context consumption graph directly inside the task header. This is more than a nice-to-have telemetry widget. When an agentic run burns through its context window, the model either truncates history or degrades reasoning quality. By visualizing consumption per turn, I can spot the trajectory early and take proactive steps—clearing chat history or switching to a larger context model—before the agent starts hallucinating or forgetting the task scope. It shifts the workflow from reactive firefighting to preemptive capacity planning.
What's Still Stuck in the Pipeline
The remaining three items expose different leaks in the same cognitive boat:
Issue #8334 (open): Session TODO items currently render their full text when checked off, cluttering the chat with walls of completed task descriptions. Truncating that output would let me scan the agent's step-by-step progress without parsing through strikethrough noise. It's a small surface change, but in long agentic runs, that visual compression adds up.
Issue #8418 (open, with PR #9704): Reasoning blocks stay collapsed by default, which means the agent's chain-of-thought is hidden until I manually expand it. In an IDE-integrated tool where the agent can write files and execute commands, hiding motivation behind a click is a transparency gap. Default expansion would let me audit why an action is chosen before it executes, improving both review accuracy and my confidence in the output.
Issue #9706 (open): Terminal command output—think test suites, linters, or build logs—currently dumps its full stream into the chat view. The proposal applies the same folding UX already used for reasoning blocks, collapsing lengthy output to just the top bar and adding a display setting to control default behavior. Without this, a single verbose
npm testrun can push the actual reasoning and code diffs completely off-screen, forcing me to scroll back up to regain context.
No latency benchmarks have been published for any of these improvements, so I can't point to exact millisecond savings. Architecturally, though, they all attack the same bottleneck: the IDE chat panel is finite real estate, and unbounded streams from context windows, TODO lists, reasoning traces, and terminal logs fight for my attention simultaneously. When three out of four fixes remain open, that surface area stays largely unprotected.
The completion of #8210 validates that visibility-driven mitigation works. But shipping one graph while leaving TODO truncation, reasoning transparency, and terminal folding on the table means Kilo Code v7 is currently delivering a quarter of a visibility overhaul. For an agentic IDE companion, that's a lopsided ratio that leaves operators doing too much manual window management instead of reviewing code.
Performance Optimizations in v4.21.0
Kilo Code 4.21.0, shipped on May 7, 2025, isn't just a routine version bump. It synchronizes the fork with Roo Code v3.15.5 while layering several first-party optimizations that target the exact friction points I notice when working with large repositories or rapidly switching contexts. When I look at the changelog, what stands out is a clear focus on moving blocking work off the main thread and reducing perceptual latency during everyday IDE interactions.
Moving Token Counting to a Web Worker
The most significant architectural change in this release is the decision to offload token counting to a dedicated web worker. In previous versions, token counting ran on the main thread. For sizable files or complex codebases, this created noticeable UI freezes right when the extension needed to calculate whether incoming context fit within the LLM's window limits. I can see why this was painful: every time the agent ingested a large file or summarized a lengthy conversation, the entire VS Code interface would stall while the tokenizer crunched numbers.
By pushing this to a web worker, Kilo Code keeps the extension host responsive. The main thread stays free to handle user input, render updates, and manage LSP interactions while the worker handles the computationally heavy token math in parallel. This change, contributed by @samhvw8, directly addresses one of the most common complaints in agentic IDEs: jank during context window management.
Faster Mode Switching and Settings Handling
Another area where I notice immediate quality-of-life improvements is mode switching latency. Transitions between the Code, Debug, Ask, and Plan agents now feel snappier, thanks to optimizations from @dlab-anton. In practice, this means less waiting when I pivot from writing a feature to asking a clarifying question or debugging a failed test. The context swap happens closer to instantaneously, which matters when you're iterating rapidly and switching mental models every few minutes.
Under the hood, the team also tightened settings handling. Configuration parsing is now more efficient, with fewer redundant I/O operations and better caching of frequently accessed values. When I think about how often an IDE extension reads settings during a single session—theme toggles, API keys, model preferences, auto-approve thresholds—this reduction in disk thrashing and repeated config parsing adds up to a smoother overall experience.
Sound Notifications and UI Polish
I appreciate the smart sound notifications update contributed by @olearycrew to the upstream Roo Code project. Instead of pinging the user for every intermediate step, audio alerts now trigger only when the system actually requires human intervention. This cuts down on notification fatigue during long agent runs, letting me stay in flow until my attention is genuinely needed.
On the visual side, Kilo Code 4.21.0 inherits a suite of UI refinements from Roo Code v3.15.5 that I find particularly well-targeted. The chat view padding adjusts better for narrow sidebar layouts, sidebar resize issues are fixed, and auto-approve toggle buttons now render correctly in high-contrast VS Code themes. These aren't cosmetic afterthoughts; they fix real accessibility and layout bugs that break muscle memory.
Inherited Upstream Improvements
The Roo Code v3.15.5 merge brings substantial backend and integration work. Chat performance and rendering saw improvements to code block rendering and overall chat view responsiveness. More critically, a bug fix resolves hangs in orchestrator mode—a failure mode that could deadlock the entire agent loop when coordinating multiple tools.
The Gemini integration received particular attention. The update bumps @google/genai to v0.12, enhances prompt caching efficiency, fixes streaming completion bugs, and extends prompt caching support to the Google Vertex provider. For teams running Google's models through Vertex, this should translate to lower latency and reduced token costs on repeated prompts.
Terminal handling also got more robust. The upstream fixes address empty command bugs, implement fallback mechanisms for command execution, and add direct chat UI controls to stop terminal processes. They also fixed stderr capture in execa-spawned processes, which means error output from spawned shells finally surfaces correctly in the agent's context. Combined with improved multi-root workspace support, these changes make Kilo Code feel significantly more stable in complex, real-world development environments.
When I step back and analyze this release, it reads like a maintenance milestone done right: the Kilo Code team prioritized main-thread hygiene, settings I/O efficiency, and upstream stability over flashy new features. That discipline tells me they're building this fork for sustained daily use rather than demo-driven development.

Custom Agent Configuration: Power and Complexity
I noticed that Kilo Code treats agent configuration as a deeply layered system rather than a simple preset menu. The platform distinguishes between global agents available across every project and project-specific agents locked to a single workspace, but the real complexity emerges from the sheer surface area of properties each agent can carry. Every custom agent is defined by a dense set of fields: its name is pulled directly from the .md filename; its description surfaces in the agent picker; its model is pinned in a strict provider/model format like anthropic/claude-sonnet-4-20250514; and its prompt consists of the full markdown body injected straight into the system prompt. Beyond those basics, agents carry behavioral controls including mode (primary for user selection, subagent for task-tool invocation only, or all), steps to cap agentic iterations before forcing a text-only response, and sampling parameters like temperature and top_p. There is even a variant field for default model variants and a color property using hex values or theme keywords to customize the picker UI.
The Permission Model and Built-in Overrides
What stands out to me is the granularity of the permission system. Rather than a simple on/off switch, permissions use ordered rules with allow, deny, and ask actions scoped through glob patterns—for example, *.md: allow. This means every agent can have its own tool-access profile, but it also means teams must reason about rule ordering and pattern matching for each custom definition. Additionally, any built-in agent—whether code, plan, debug, ask, orchestrator, explore, or general—can be silently overridden by creating a custom agent with the exact same name. That is powerful for tailoring behavior, yet it introduces a shadowing risk where a file dropped in the wrong directory accidentally redefines a core workflow.
Four Creation Paths and Directory Conventions
Kilo Code offers four distinct ways to create an agent, and each path writes to a different layer of the stack. I can ask Kilo to generate one through natural language, navigate through Settings → Agent Behaviour → Agents in the UI, author raw .md files inside .kilo/agents/, .kilo/agent/, or .opencode/agents/, or declare them inside kilo.jsonc under the agent key. Global agents live in ~/.config/kilo/agent/, keeping project-specific directories clean. The flexibility is genuine, but the directory naming alone—.kilo/agents/ versus .kilo/agent/ versus .opencode/agents/—already signals how fragmented the surface is.
The Precedence Ladder and Partial Overrides
When I look at how these sources interact, the precedence chain is unambiguous but steep: built-in defaults sit at the bottom, followed by global config (~/.config/kilo/kilo.jsonc), then project config (kilo.jsonc at the project root), then directory configs and individual agent .md files, with environment variable overrides (KILO_CONFIG_CONTENT) at the very top. The system merges properties rather than replacing them wholesale, which means a project-level kilo.jsonc can tweak just the temperature or steps value without duplicating the entire agent definition. That is architecturally elegant, yet it demands that developers maintain a mental model of which layer owns which field.
The Team Standardization Problem
For me, the trade-off crystallizes here. The combination of four creation methods, a five-layer merge precedence, and glob-based permission scoping creates genuine cognitive overhead. When I am trying to standardize agent behavior across a team, I have to ask: did someone override the orchestrator agent in a global .md file, or was it patched via an environment variable on a CI runner? Is the *.md: allow rule in the project config overriding a stricter deny rule from the global layer? The system gives enormous power to shape agent behavior, but that power is distributed across so many vectors that maintaining consistency becomes a configuration management challenge in its own right.
Kilo Code Bench: Data-Driven Model Selection
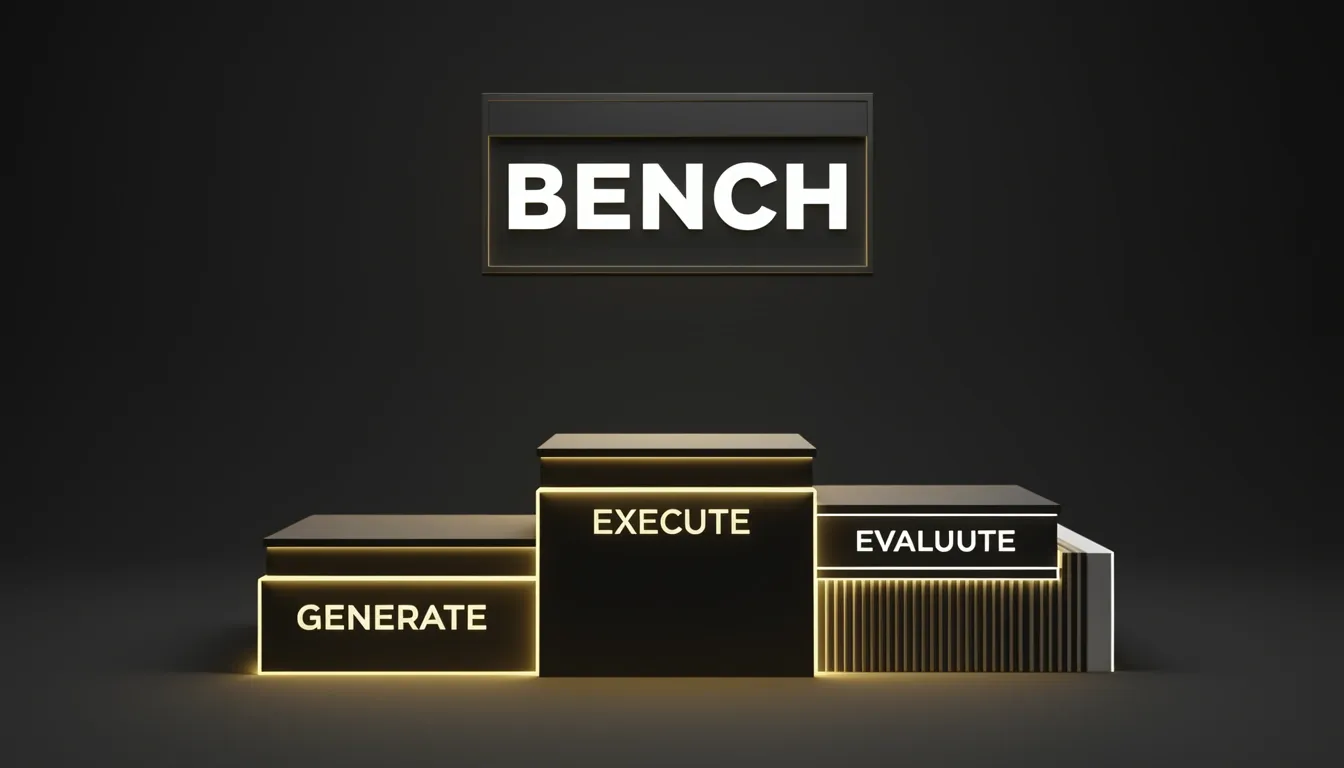
Most benchmark suites throw abstract algorithmic puzzles at models and call it a day, but I see Kilo Code Bench taking a fundamentally different approach. It treats your actual workspace as the evaluation ground. The tool runs a three-phase pipeline directly inside the VS Code extension:
- Generate: A generator model ingests the file tree, key source files, and detected languages to produce challenges scoped to your active Kilo modes.
- Execute: Each selected model tackles those problems inside an isolated workspace with full tool access, using the real Kilo mode prompts and API pipeline.
- Evaluate: A judge model scores the outputs on quality, relevance, speed, and cost, factoring in any code diffs to build a weighted leaderboard.
To me, this context-aware loop directly addresses the question every developer faces when staring at a model picker: is this model actually good for my code?
Generating Problems That Resemble Your Codebase
The first phase is where the benchmark gets its teeth. The generator model analyzes your workspace structure, identifies the programming languages in play, and then spins up challenges tailored to each active Kilo mode. These modes include:
- Architect: High-level design and structural decisions.
- Code: Implementation and feature writing.
- Debug: Error diagnosis and fixing.
- Ask: Explaining existing code or concepts.
- Orchestrator: Coordinating multi-step workflows.
Instead of asking a model to invert a binary tree, the generator uses an LLM to craft problems that mirror your actual coding context. If you’re working in a React TypeScript repo, the benchmark problems will look like React TypeScript problems. That alignment matters because model performance varies wildly between theoretical coding tasks and real-world repository manipulation.
Execution with Real Tools and Real Prompts
Phase two is where things get interesting. Each selected model runs every generated problem inside an isolated workspace, but it isn’t sandboxed into a chat bubble. The models get full tool access using the real Kilo mode prompts and the actual API pipeline. They can write code, create files, and execute shell commands. To me, this is the key distinction. You’re not testing how well a model writes a snippet in a vacuum; you’re testing how it behaves when it has to interact with a codebase using the same system prompts and tool definitions it would see in production. The isolation keeps runs from stepping on each other, while the prompt fidelity ensures the results map back to your daily workflow.
Evaluation and Scoring Mechanics
Once the runs finish, the judge model steps in for phase three. It scores each response across concrete dimensions:
- Quality: Overall correctness and robustness of the output.
- Relevance: How well the response addresses the specific problem and codebase context.
- Speed: Time-to-completion for the task.
- Cost: Token spend and economic efficiency.
It also inspects any code diffs produced during execution, so the scoring accounts for actual structural changes, not just conversational polish. The raw scores get normalized and weighted into composite scores that feed a leaderboard ranking. I like that the economics are surfaced right next to the performance metrics. A model might write beautiful diffs but burn through tokens twice as fast, and this pipeline makes that trade-off explicit.
Away designs can explore colours beyond a club's usual home palette. For fans comparing modern and retro styles, Argentina national team jersey(camiseta de la selección argentina) keeps the focus on the selected identity. Small construction details can make a noticeable difference during long matchdays.
Codebase Structure and Maintainability
The implementation spans roughly 3,500 lines across 29 files, and the separation of concerns is immediately obvious. Generation, execution, and evaluation live in distinct boundaries. That modularity isn’t just clean; it makes the pipeline extensible. If you want to tweak how the judge weights cost versus quality, or add a new Kilo mode to the generator, you don’t have to untangle a monolithic script.
What ties this together is the user-facing goal: giving you a data-backed answer to the question, “Which model should I use?” Because the entire loop runs inside the VS Code extension against your specific codebase and workflow, the leaderboard it produces is personal, not theoretical. You’re not guessing based on a generic benchmark site; you’re looking at results from your own code.